Weather Station Monitoring
An off-the-shelf weather station turned into a time-series archive: readings pulled into VictoriaMetrics every five minutes and read through two Grafana dashboards that set my garden against my dad's station on the other side of the village, and against government river and air quality feeds.
The pipeline
The station itself is off the shelf and does one useful thing: it pushes to Weather Underground. Everything after that is mine. A job pulls from Wunderground every five minutes and writes into VictoriaMetrics, which turns a live gauge that forgets everything into an archive that does not.
That is the whole point of the exercise. The consumer dashboards that come with a station like this will show you today, and perhaps this week, and then quietly drop it. Once the readings are in a time-series database they keep accumulating, and questions like "what is the all-time pressure low here" stop needing anyone to have written the number down at the time.
Two dashboards, two jobs
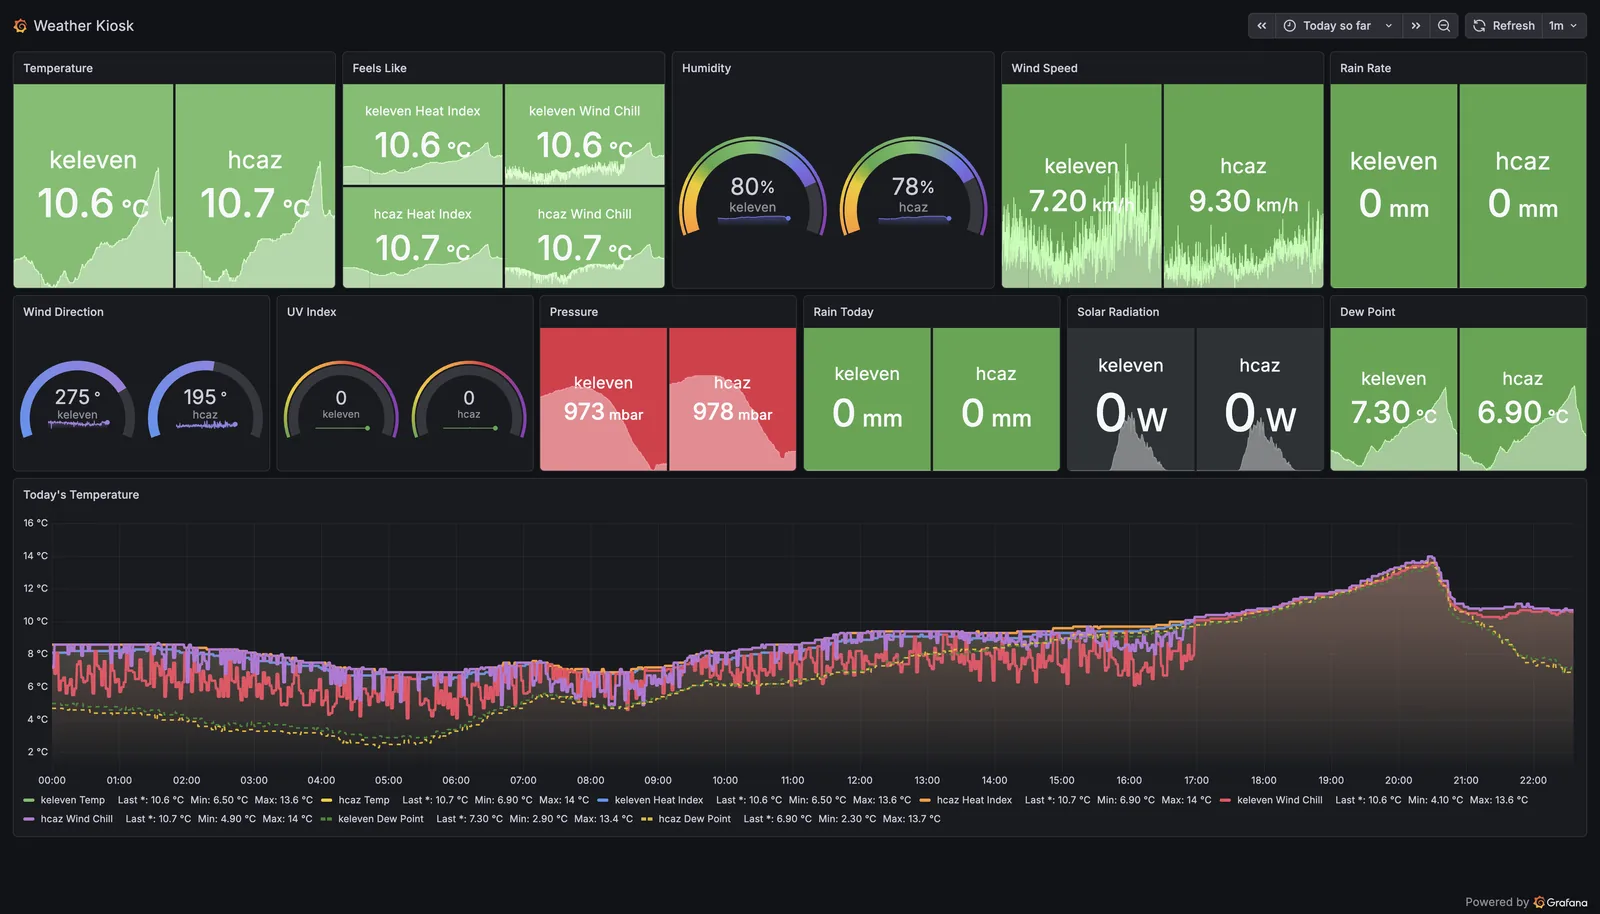
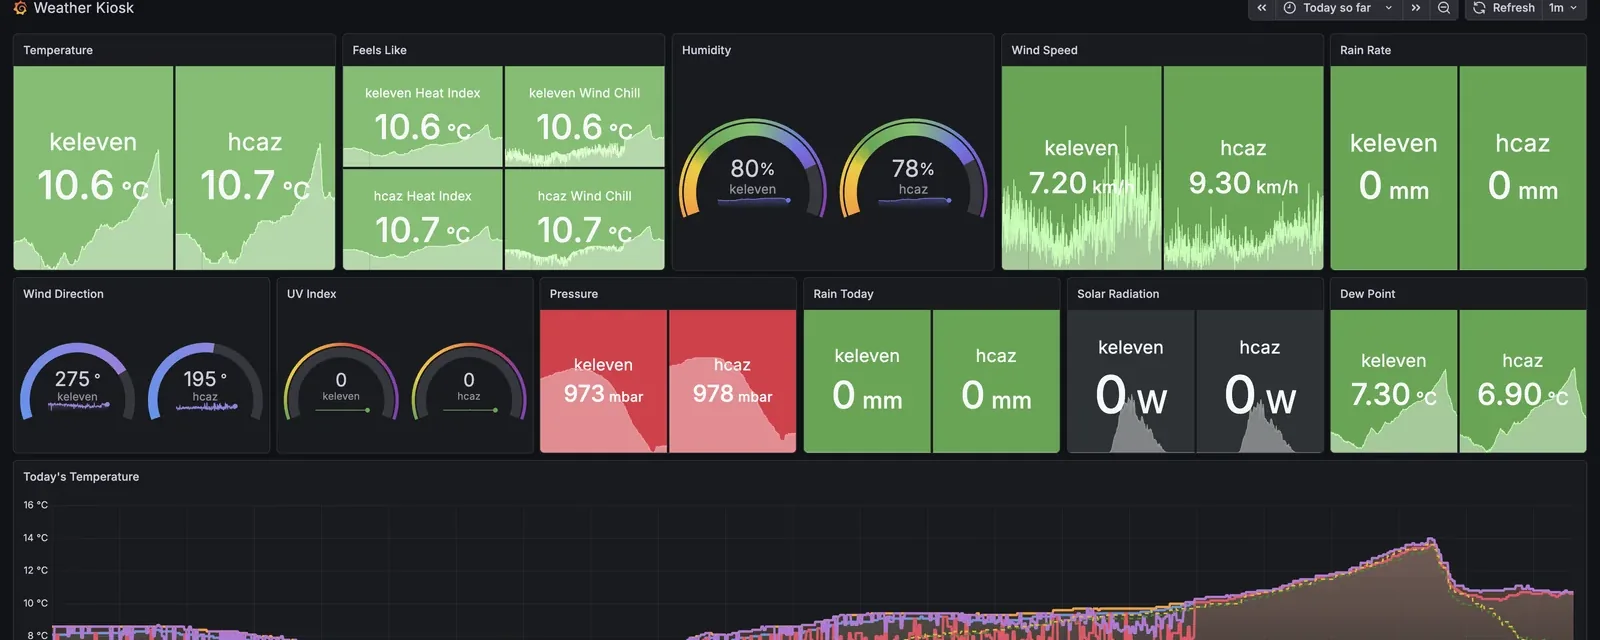
The kiosk is for glancing at. Every metric appears twice, my station beside my dad's, because his is on the other side of the village and the difference between two gardens a mile apart is more interesting than either reading alone. Wind speed, dew point and rain rate all diverge more than you would expect.
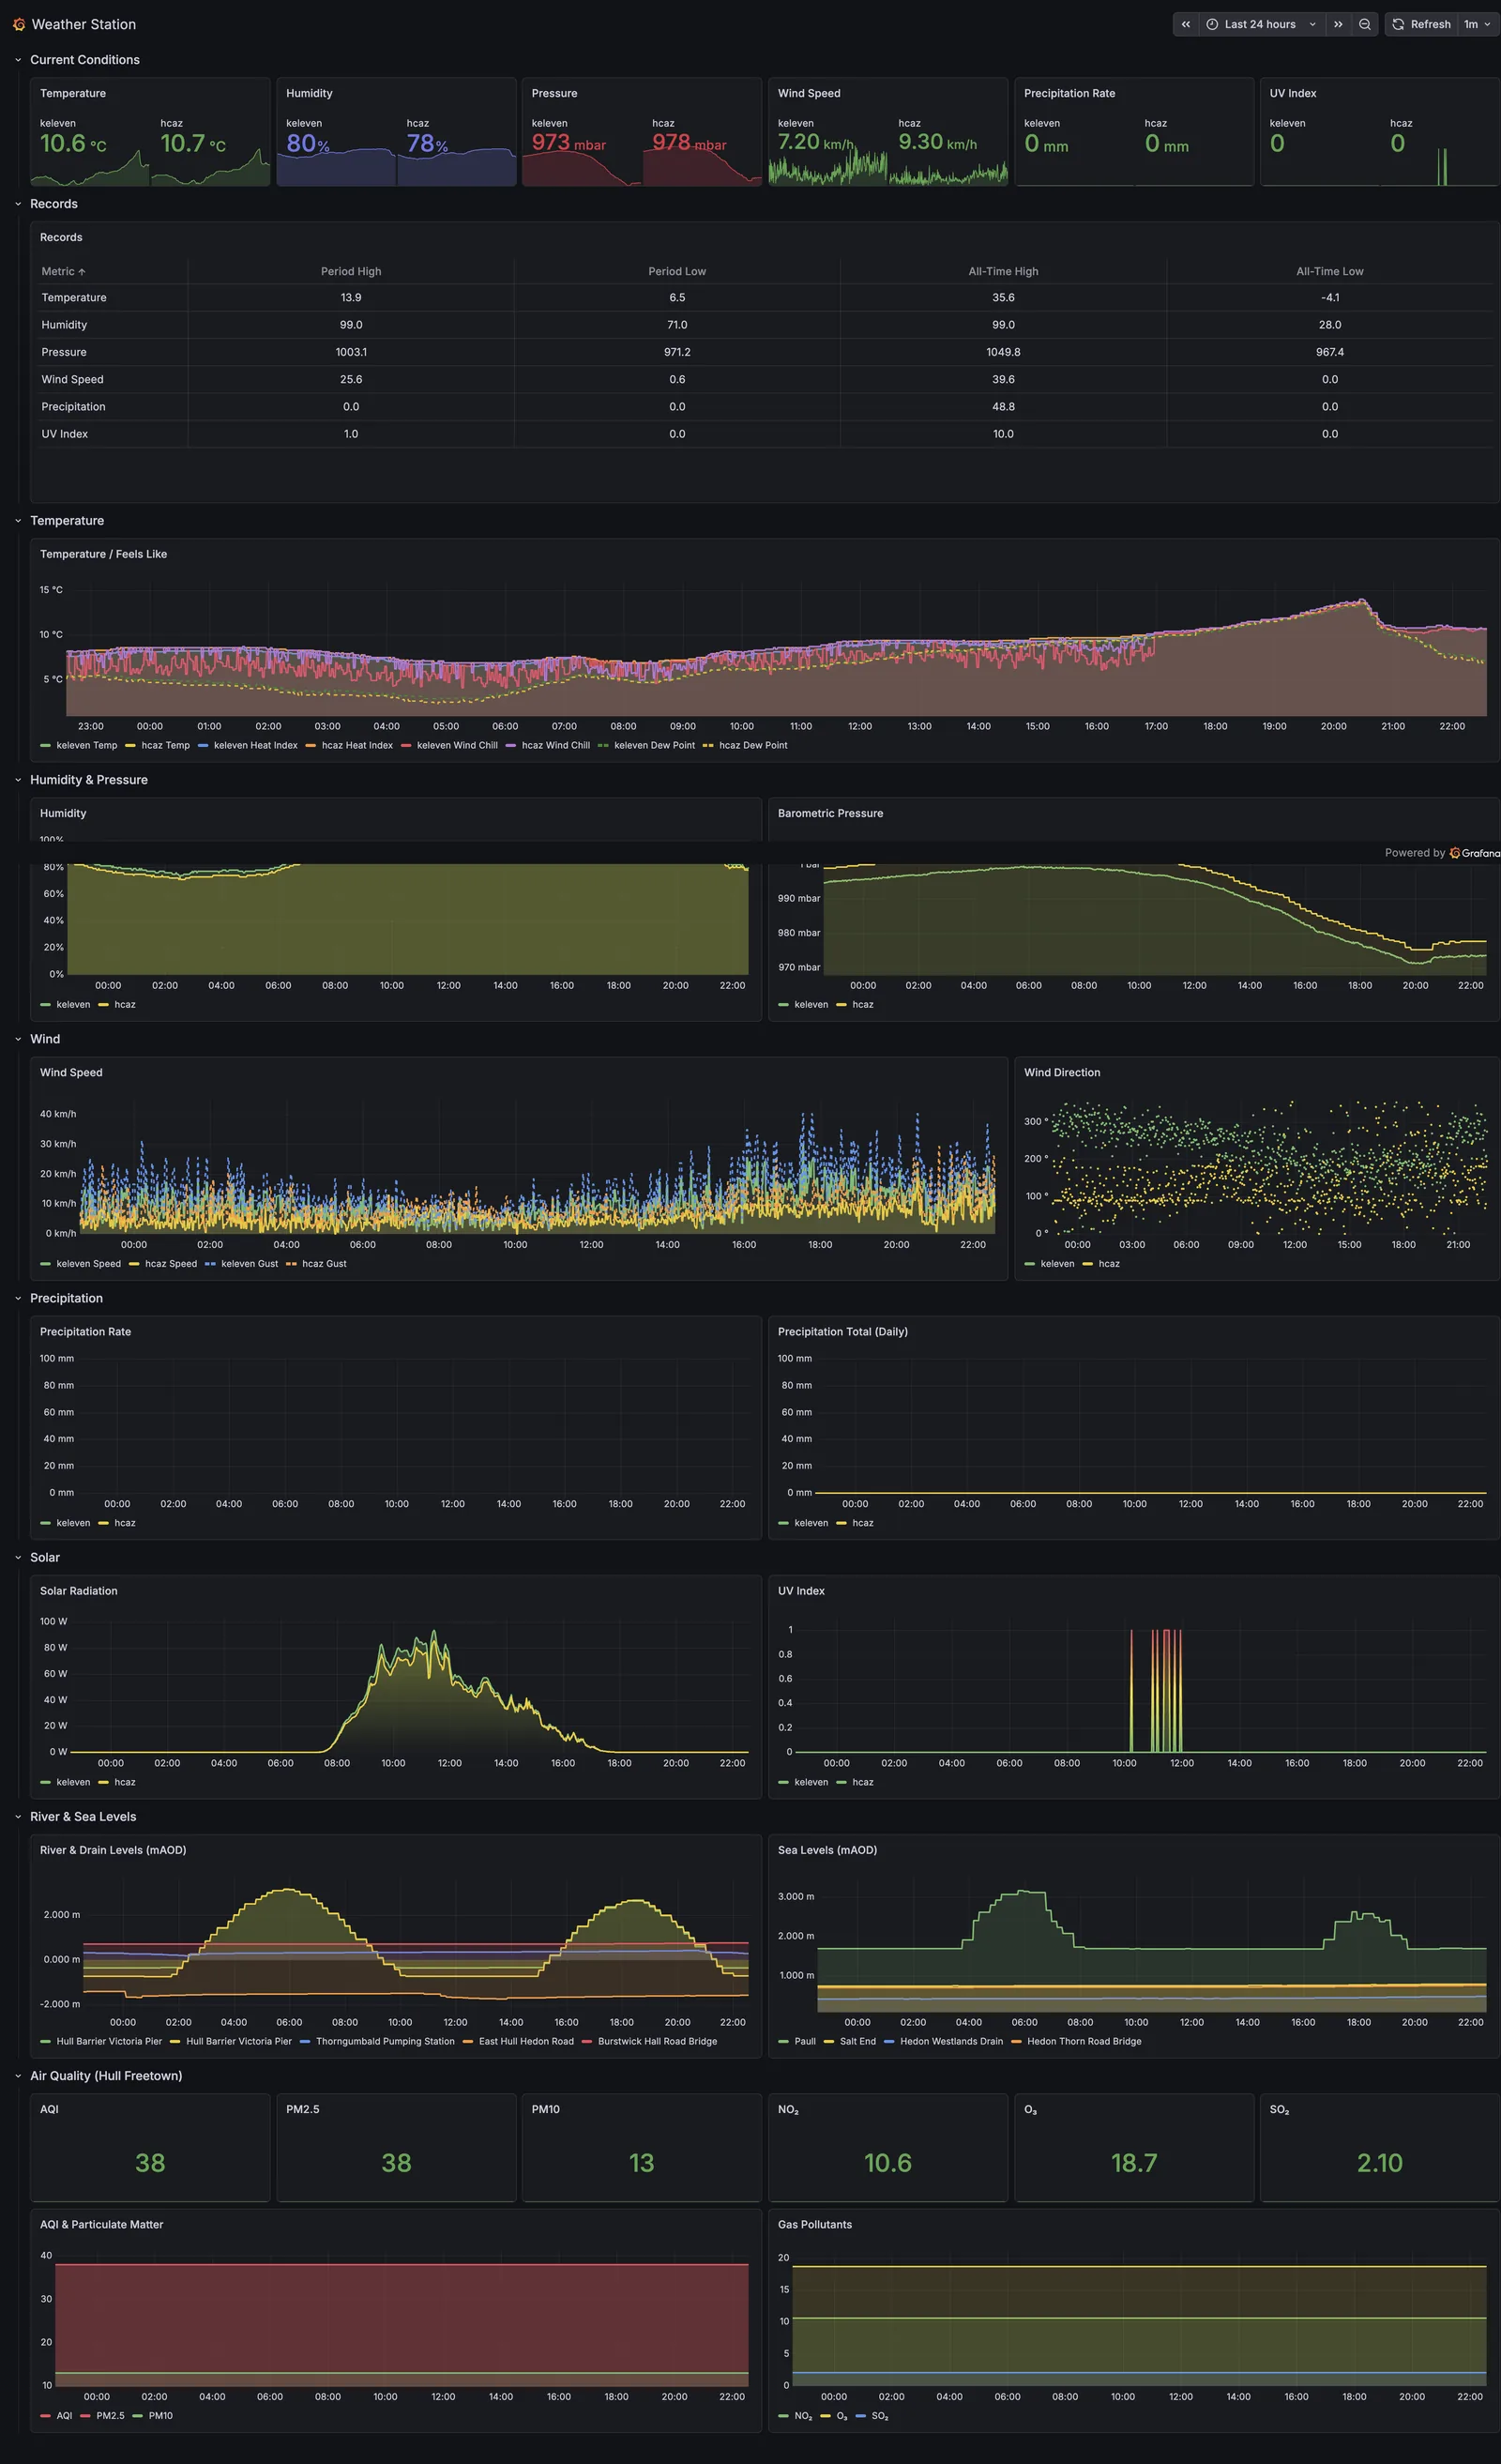
The full dashboard is for actually looking at something. Current conditions, a records table carrying period and all-time highs and lows, then temperature, humidity and pressure, wind, precipitation, and solar broken out over the last 24 hours — each one plotting both stations together.
Borrowed data
Two feeds come in that have nothing to do with the station. Environment Agency river and sea levels for the stations around the Humber — Victoria Pier, Thorngumbald, Hedon, Paull, Salt End — and air quality for Hull Freetown: AQI, particulates, and the gas pollutants.
Neither is weather exactly, but both answer questions the weather raises. A tide going out while it rains hard is the combination that matters round here.